
- Statistics is a collection of mathematical techniques that help to analyze and present data.
- Statistics is the foundation of Data Analytics and Machine Learning.
- Statistics are two types: Descriptive statistics, Inferential statistics.
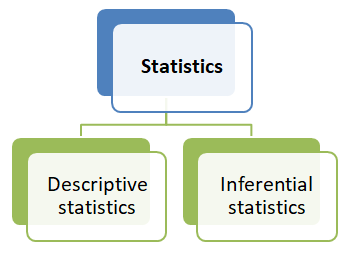
- Descriptive is the concern with the study of sample.
- When we extract sample from a particular population and we study that, we called that as Descriptive Statistics.
- Descriptive Statistics involves summarizing and organizing the data, so that can be easily understood.
- Descriptive Statistics are three types:
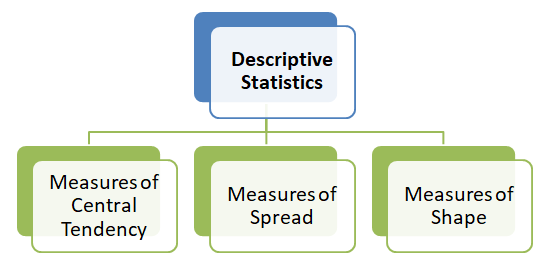
Measures of Central Tendency:
Find the central point of your dataset and that can be finding through below:
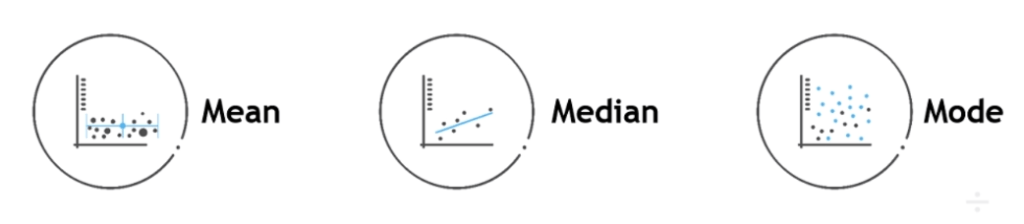
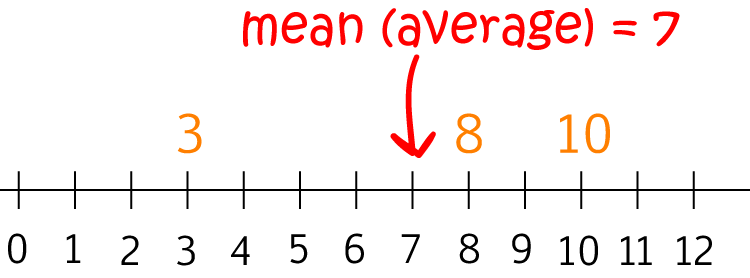
Mean:
- Average value in the dataset.
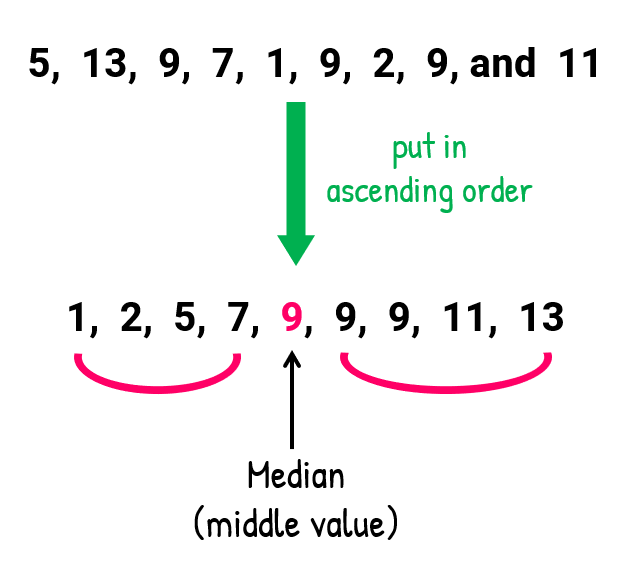
Median:
- The midpoint of the dataset.
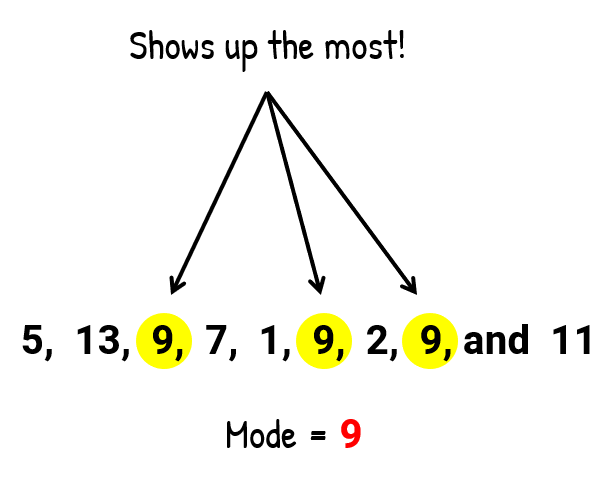
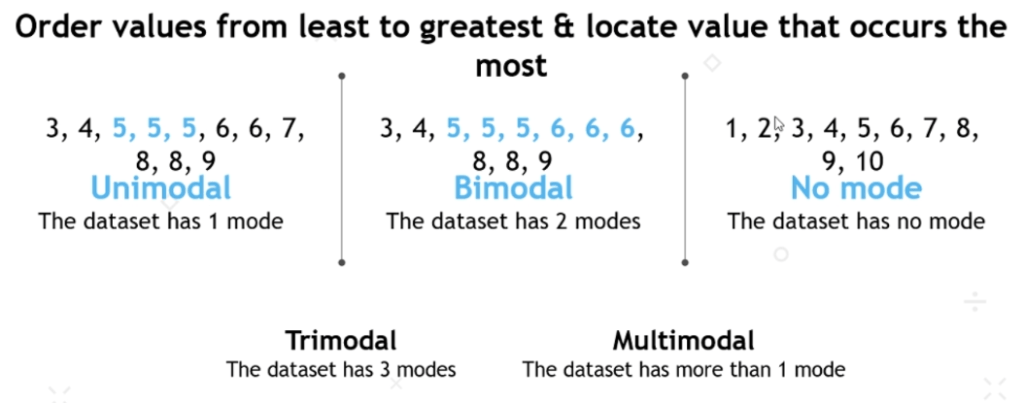
Mode:
- The most frequently occurring value in the dataset.
Measures of Spread:
- A measure of spread refers to the amount of dispersion or spread of the data point from the typical, central, value. In other words, we’re going to calculate how “spread out” our data is.
- Measure the variability of your dataset.
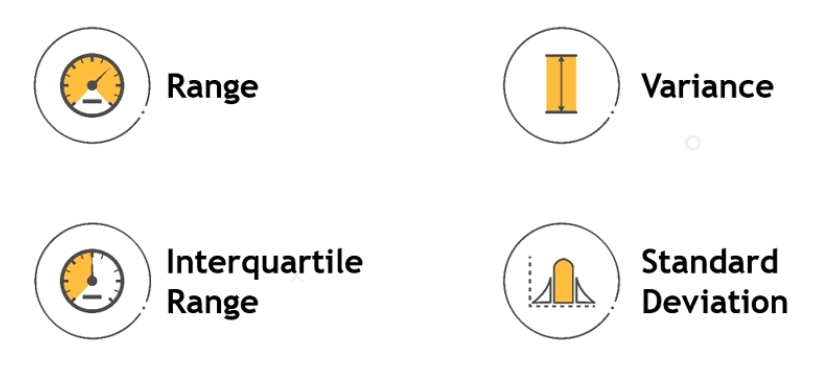
- Four main measures of dispersion for a dataset are range, variance, interquartile range, and standard deviation.
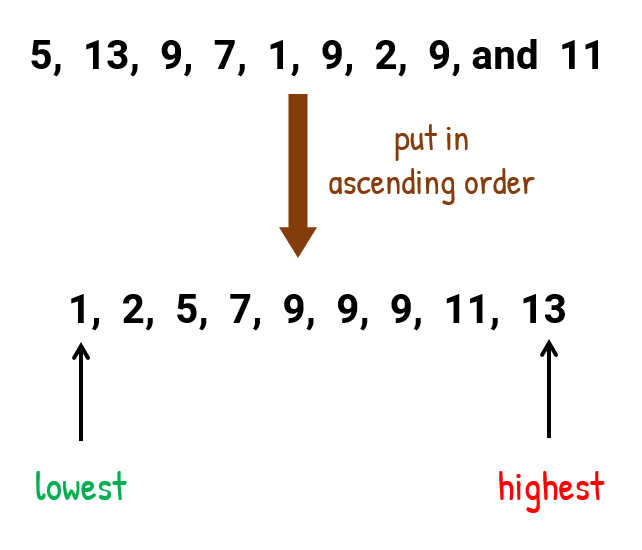
Range:
- Range is the difference between the highest and lowest data point in a distribution.
- Formula: Range (R) = Maximum – Minimum
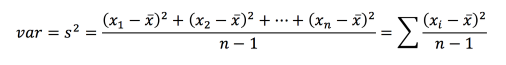
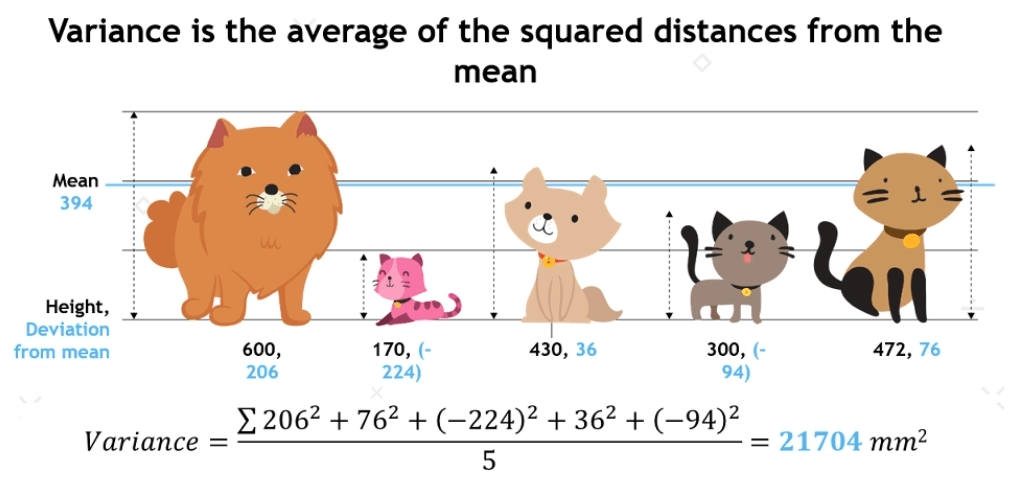
Variance:
- Variance describe how much an element deffer from mean.
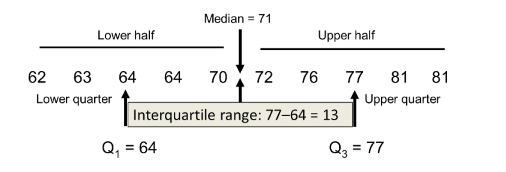
Interquartile Range (IQR):
- The IQR describes the middle 50% of values when ordered from lowest to highest.
- Majority of values (50%) closest to the center, which gives better prospective of data, or we can say unbiased data.

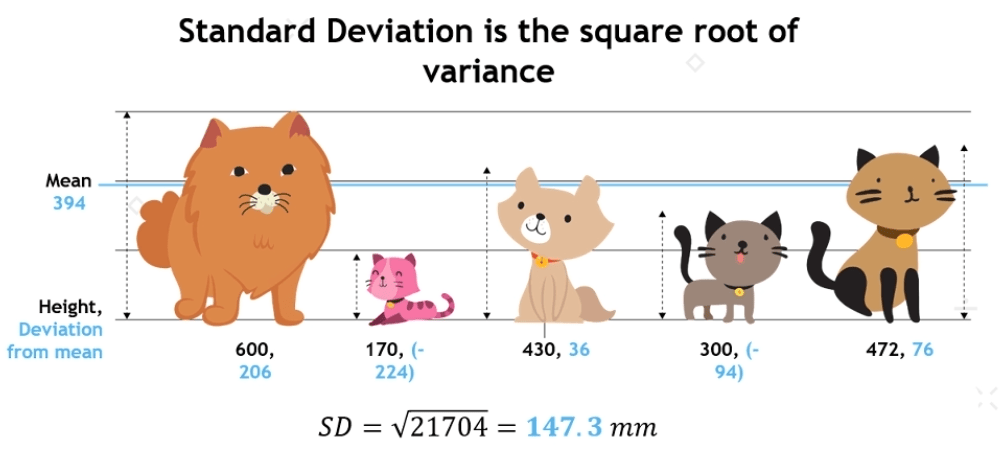
Standard Deviation:
- The standard deviation in statistics that measures the dispersion of a dataset relative to its mean and is calculated as the square root of the variance.
- Its symbol is σ (the Greek letter sigma).
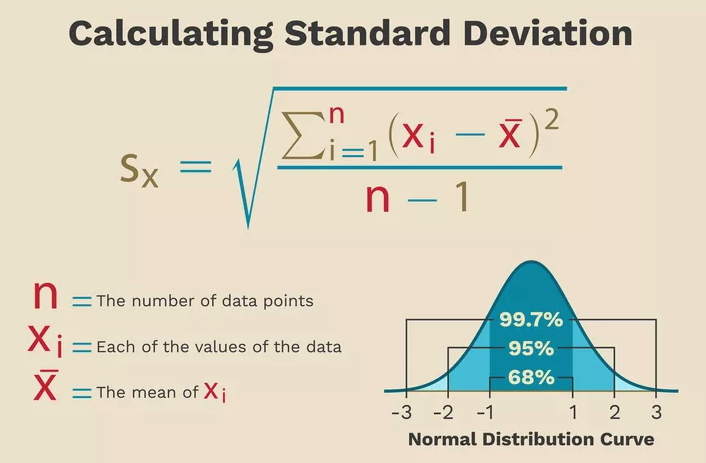
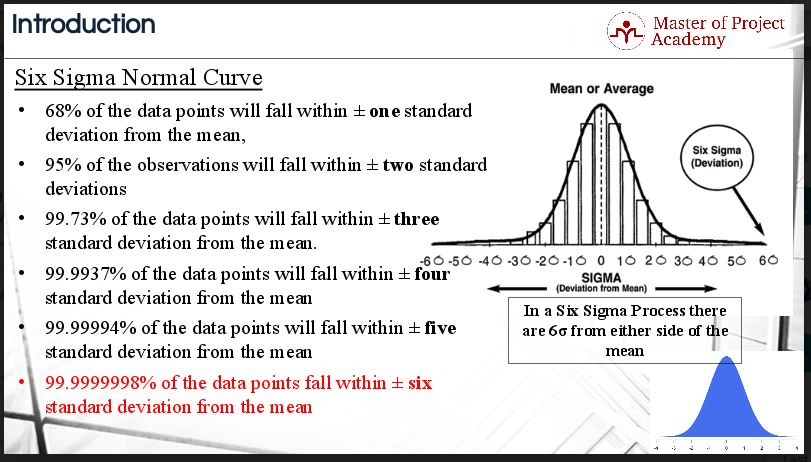
Six Sigma:
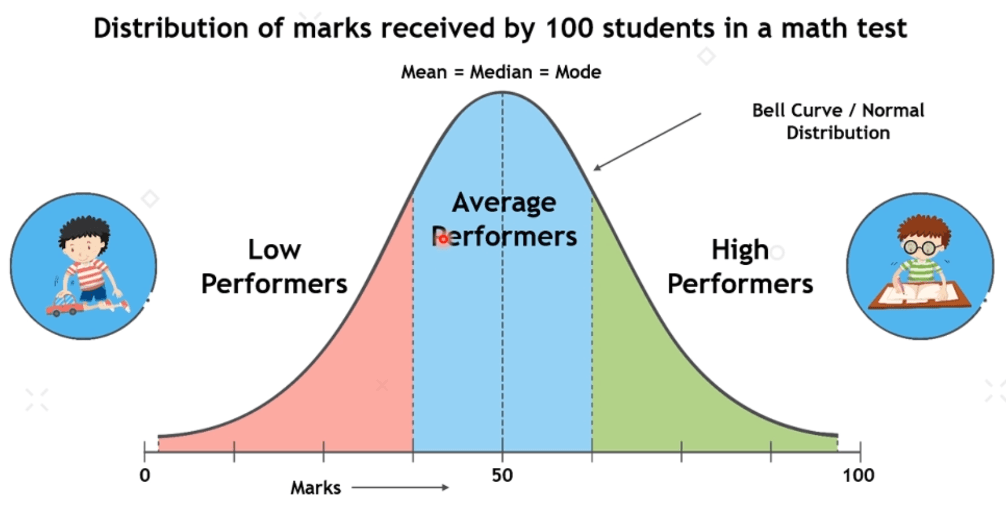
In the instance of Six Sigma, standard deviation relates to data that can be expressed as fitting a normal distribution. A normal distribution curve, sometimes known as a “bell curve,” is a plot of data where the three key measures of central tendency are all in the graph’s center.

Measures of Shape:
- Measures of shape describe the distribution (or pattern) of the data within a dataset.
- Shape gives you the clear picture where is your data plotted.
It has three sub categories:
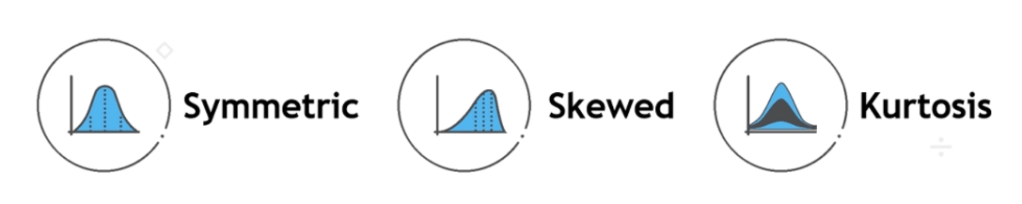
Symmetric:
Symmetric means if the distributions having the same shape on both sides of the center. Moreover, those with only one peak are known as a normal distribution.
Skewness:
Skewness refers to the degree of asymmetry in a distribution. And, asymmetry reflects extreme scores in a distribution. Moreover, it includes positive and negative skewness.
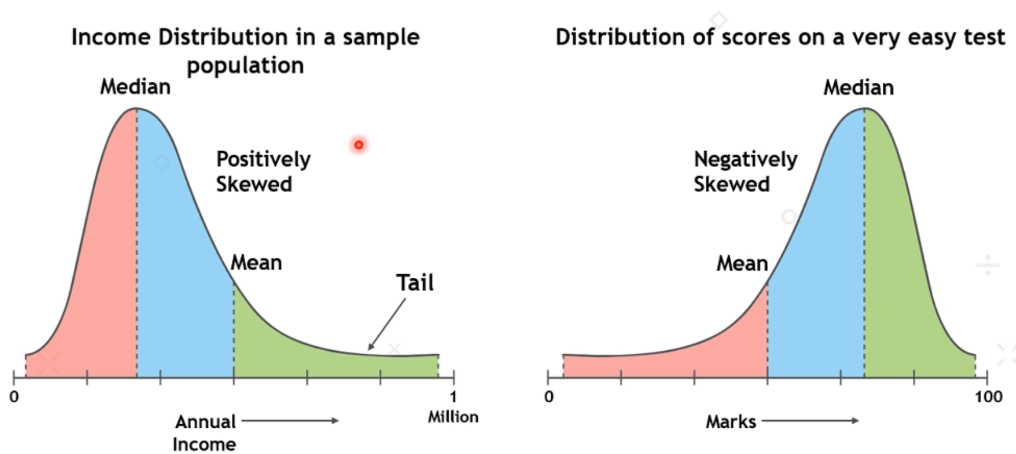
1. Positively skew
It is when it has a tail extending out to the right so, the mean is greater than the median and the mean is sensitive to each score in the distribution. Moreover, it is subject to large shifts when the sample is small and contains extreme scores.
2. Negatively skew
Negative skew has an extended tail pointing to the left and reflects bunching of numbers in the upper part of the distribution. Moreover, it has fewer scores at the lower end of the measurement scale.
Kurtosis:
Kurtosis explain what is the concentration of data at center point.

Like skewness, Kurtosis is a descriptor of shape and it describes the shape of the of the distribution in terms of height or flatness.
There are three types of kurtosis: Mesokurtic, Leptokurtic, and Platykurtic.
- Mesokurtic: Distributions that are moderate in breadth and curves with a medium peaked height.
- Leptokurtic: More values in the distribution tails and more values close to the mean (i.e. sharply peaked with heavy tails)
- Platykurtic: Fewer values in the tails and fewer values close to the mean (i.e. the curve has a flat peak and has more dispersed scores with lighter tails).
To be continued..
References:
- ChiliMath: https://www.chilimath.com/lessons/intermediate-algebra/mean-median-mode-and-range/
- Some images and content credit goes to INSAID.

Leave a comment