
What is Time Series?
- The set of data collected on the basis of time is called time series.
- Time series forecasting is basically the machine learning modelling for Time Series data (years, days, hours…etc.) for predicting future values using Time Series modelling. This helps if your data in serially correlated.
Importance of time series:
Study past behavior of data.
- Product sales figure
Forecast future.
- Predicting boom or recession
- Future possibility
- It is used extensively in financial, business forecasting based on historical trends and patterns
Estimates trade cycle.
- Estimating winning trade.
Comparison
- Year by year profit comparison.
- It helps to compare the performance of two different series of a different type for the same time duration.
Sample Time Series Data:
A time series data for stock price looks like:
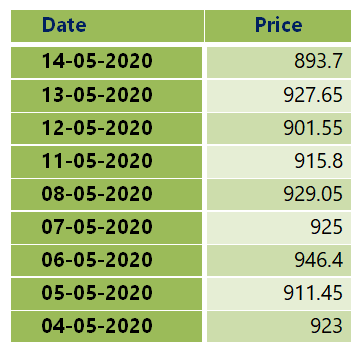
The data can be yearly, quarterly, monthly, weekly, daily or even hourly basis. One interesting thing in time series is that the time interval needs to be constant. For eg:- We can’t have time series like sales data captured at 6:00 PM, 6:15 PM, 6:45 PM or 7:30 PM and so on. The difference between the previous intervals needs to be constant.
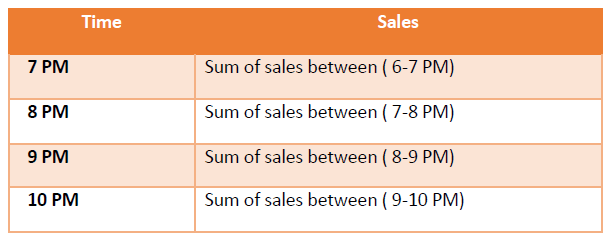
One way to resolve time series data is to use bins. Group the data in different time duration like below.
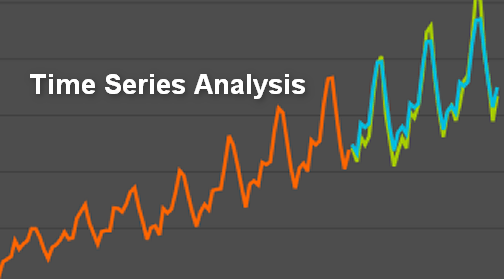
Graphical representation of time series data.
Here the line chart shows that stock price is in uptrend or increasing with time.

Components of a Time Series
Time Series Analysis helps us to recognize the major components in a time series data
It has four main components:
- Trend
- Seasonality
- Cyclicity
- Irregularity
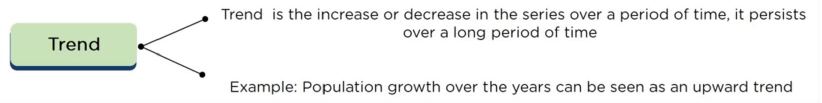
Trend
Trend is the increase or decrease in the series over a period of time, it persists over a long period of time.
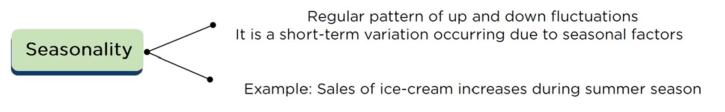
Seasonality
Occurs every year and duration is for short term like festival season.
Cyclicity
Duration between the events are longer and may not occur every year

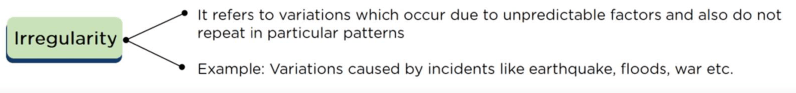
Irregularity
Randomness and uncertain to predict, also called as errors.
To be continued..

Leave a comment